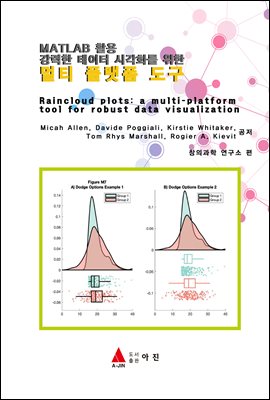
MATLAB활용 강력한 데이터 시각화를 위한 멀티 플랫폼 도구
- 저자Micah Allen, Davide Poggiali, Kirstie Whitaker,Tom Rhys Marshall, Rogier A. Kievit 저
- 출판사아진
- 출판일2020-07-10
- 등록일2020-12-21
- SNS공유


- 파일포맷PDF
- 파일크기12MB
- 공급사YES24
-
지원기기
PC
PHONE
TABLET
프로그램 수동설치
전자책 프로그램 수동설치 안내
아이폰, 아이패드, 안드로이드폰, 태블릿,
보유 1, 대출 0,
예약 0, 누적대출 8, 누적예약 0
책소개
Across scientific disciplines, there is a rapidly growing recognition of the need formore statistically robust, transparent approaches to data visualization.
Complementary to this, many scientists have called for plotting tools that
accurately and transparently convey key aspects of statistical effects and raw data
with minimal distortion. Previously common approaches, such as plotting
conditional mean or median barplots together with error-bars have been criticized
for distorting effect size, hiding underlying patterns in the raw data, and
obscuring the assumptions upon which the most commonly used statistical tests are
based. Here we describe a data visualization approach which overcomes these
issues, providing maximal statistical information while preserving the desired
‘inference at a glance’ nature of barplots and other similar visualization devices.
These “raincloud plots” can visualize raw data, probability density, and key
summary statistics such as median, mean, and relevant confidence intervals in an
appealing and flexible format with minimal redundancy. In this tutorial paper, we
provide basic demonstrations of the strength of raincloud plots and similar
approaches, outline potential modifications for their optimal use, and provide
open-source code for their streamlined implementation in R, Python and Matlab (
https://github.com/RainCloudPlots/RainCloudPlots). Readers can investigate the R
and Python tutorials interactively in the browser using Binder by Project Jupyter.
목차
제 1편 : MATLAB 기본편1. MATLAB 기본사용편 ···················· 003
1.1 MATLAB 시작하기 ·························· 003
명령창(command Window)에서의 입력 005
도움말(Help)의 이용 ······························· 007
1.2 입력 오류의 수정 ····························· 008
계산의 중지 ·············································· 009
MATLAB 종료하기 ································· 009
1.3 연산과 변수의 할당 ·························· 009
연산자 우선순위 ······································· 011
내장함수 ···················································· 012
1.4 데이터의 표현 ··································· 013
1.5 변수의 처리 ······································· 015
변수 이름 ·················································· 015
clear 명령어 ············································· 016
특수변수와 정수 ······································· 017
whos 명령어 ············································ 017
1.6 벡터와 행렬 ······································· 018
벡터 ··························································· 018
행렬 ·························································· 023
스크린 출력과 억제 ································· 024
1.7 랜덤(Random)수와 복소수 ·············· 025
랜덤 수 ····················································· 025
복소수 ······················································· 027
1.8 기호를 이용한 연산 ·························· 028
기호식에서의 치환 ··································· 029
1.9 코드 파일 ·········································· 030
스크립트 코드 파일 ································· 030
코멘트의 추가 ·········································· 032
함수 코드 파일 ···································· 033
사용자 정의함수 ······································ 036
1.10 간단한 그래프의 생성 ····················· 037
ezplot을 이용한 그래프 ·························· 037
plot을 이용한 그래프 ·························· 039
3차원 그래프 ··········································· 042
1.11 MATLAB과 엑셀(Excel)의 접속 043 엑셀 데이터 불러오기 ····························· 043
데이터 가져오기 옵션 ························· 046
스크립트 생성 옵션 ································· 049
함수 생성 옵션 ········································ 049
생성된 데이터를 엑셀파일로 저장하기 ·· 050
제 2편 : 연구논문
1. Introduction 53
2. Code tutorials: how to make it rain 56
3. Conclusion 84
4. References 85


